

Did AI speed us up?
A trend analysis of 2,410 completed tickets at Kerno spanning January 2025 to May 2026, with focus on pre and post AI tooling adoption, September 2025.
Background
As the conversation about the return of investment (ROI) associated with AI intensifies I decide to do some analysis across our Linear database to see if AI has had an impact on engineering at Kerno. Notionally, being part of a small team you can ‘feel’ the productivity gains, but I wanted to anchor this in data.
Preface: During my ROI hunting expedition, I did not link ROI back to customer driven $. This expedition was focused purely on productivity. In next editions I will traverse back to features and $-value creation.
Context
To help you digest this piece, there is context that had a material impact on the numbers:
Like most companies in 2025 we deemed that AI coding agents weren’t good enough to start writing production acceptable code until around August/September last year.
The majority of our team were skeptical of LLMs in the application of code generation. This meant that there was an initial education ramp through August and September, where engineers were provided with space to experiment and explore.
We had 40% attrition during the past 12 months as we changed product direction and some roles were no longer needed.
We released a major refactor of our product in March which attributed to a spike across all graphs [tickets, tokens, bugs]. While I didn’t adjust for this in the dataset, I will add notes and draw my final conclusion based on this.
All our engineers have 10+ years of experience.
While not all code is generated by AI, the rough estimated is that 70% is.
I have not accounted for the PoC scrapyard or technical debt in this analysis.
Beyond the obvious
If I asked each of my engineers the question… is AI helping you, the answer is an easy yes, but I wanted to look beyond the usage metrics. I wanted to understand the nuances and see if there were correlations across certain dimensions:
Adoption: While every team have AI power users, AI code generation can only have a true org wide uplift if the majority of your engineers have bought in to it and are using effectively*. I wanted to check what adoption looked like across the team.
*effectively means something different for everyone, so let’s just say they are moving beyond basic prompting and investing time to make this tool better for them.
Bug Velocity: Shipping fast means nothing if what you ship is slop, it undermines progress. While software bugs are part of doing business (and always will be), I was interested in seeing if the bug velocity was up or down post introduction of AI.
Tokens: Another trend I was interested in, is how token consumption is trending. My assumption was we would have a sharp rise in tokens as we started using AI initially, but then it would fall somewhat and stabilise as we started using more skills, better scaffolding, memory layers and better prompting.
📊 Full hosted report here. [⚠️ does not contain conclusion or background context]
p.s if you want the exact skill to build the report just respond to this email
Summary
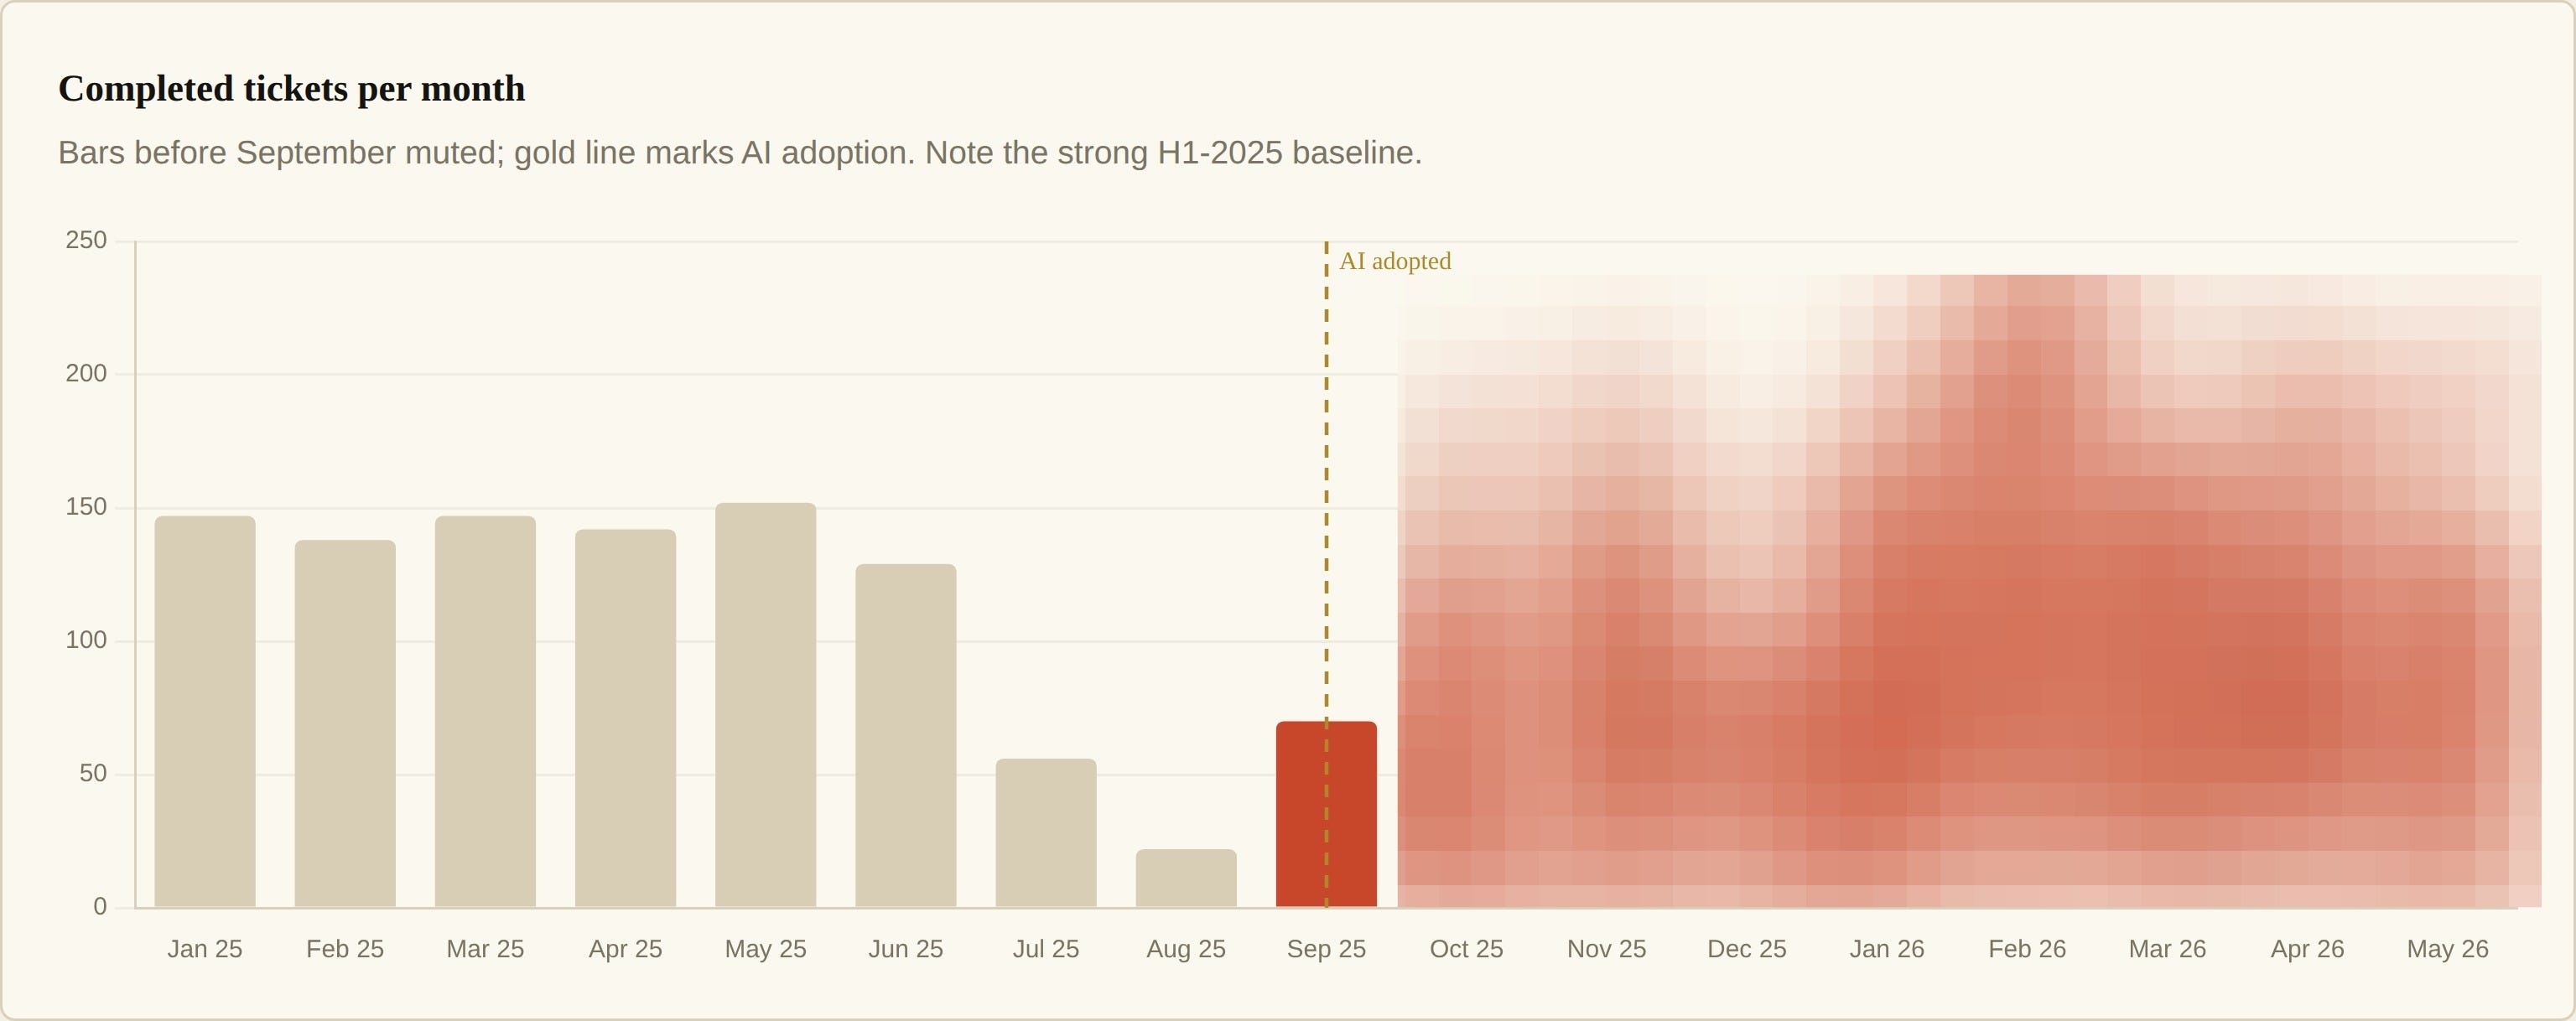
The analysis covers 17 months of completed Linear tickets, January 2025 to May 2026, split at the September 2025 adoption point: 2,410 tickets in total, 376 of them bug-labelled.
At a glance:
+180% uplift in output per FTE
Ratio of bugs:output is no different between pre and post AI (adjusting for major refactor in March).
Token consumption starting to stabilise and decline.


Adoption: did the whole team use it?
Total throughput rose by 41% (~117 → ~164 tickets/month), which undersells the attrition story. Accounting for this, per engineer output went from ~9.2 to ~25.7 tickets/month - roughly +180%

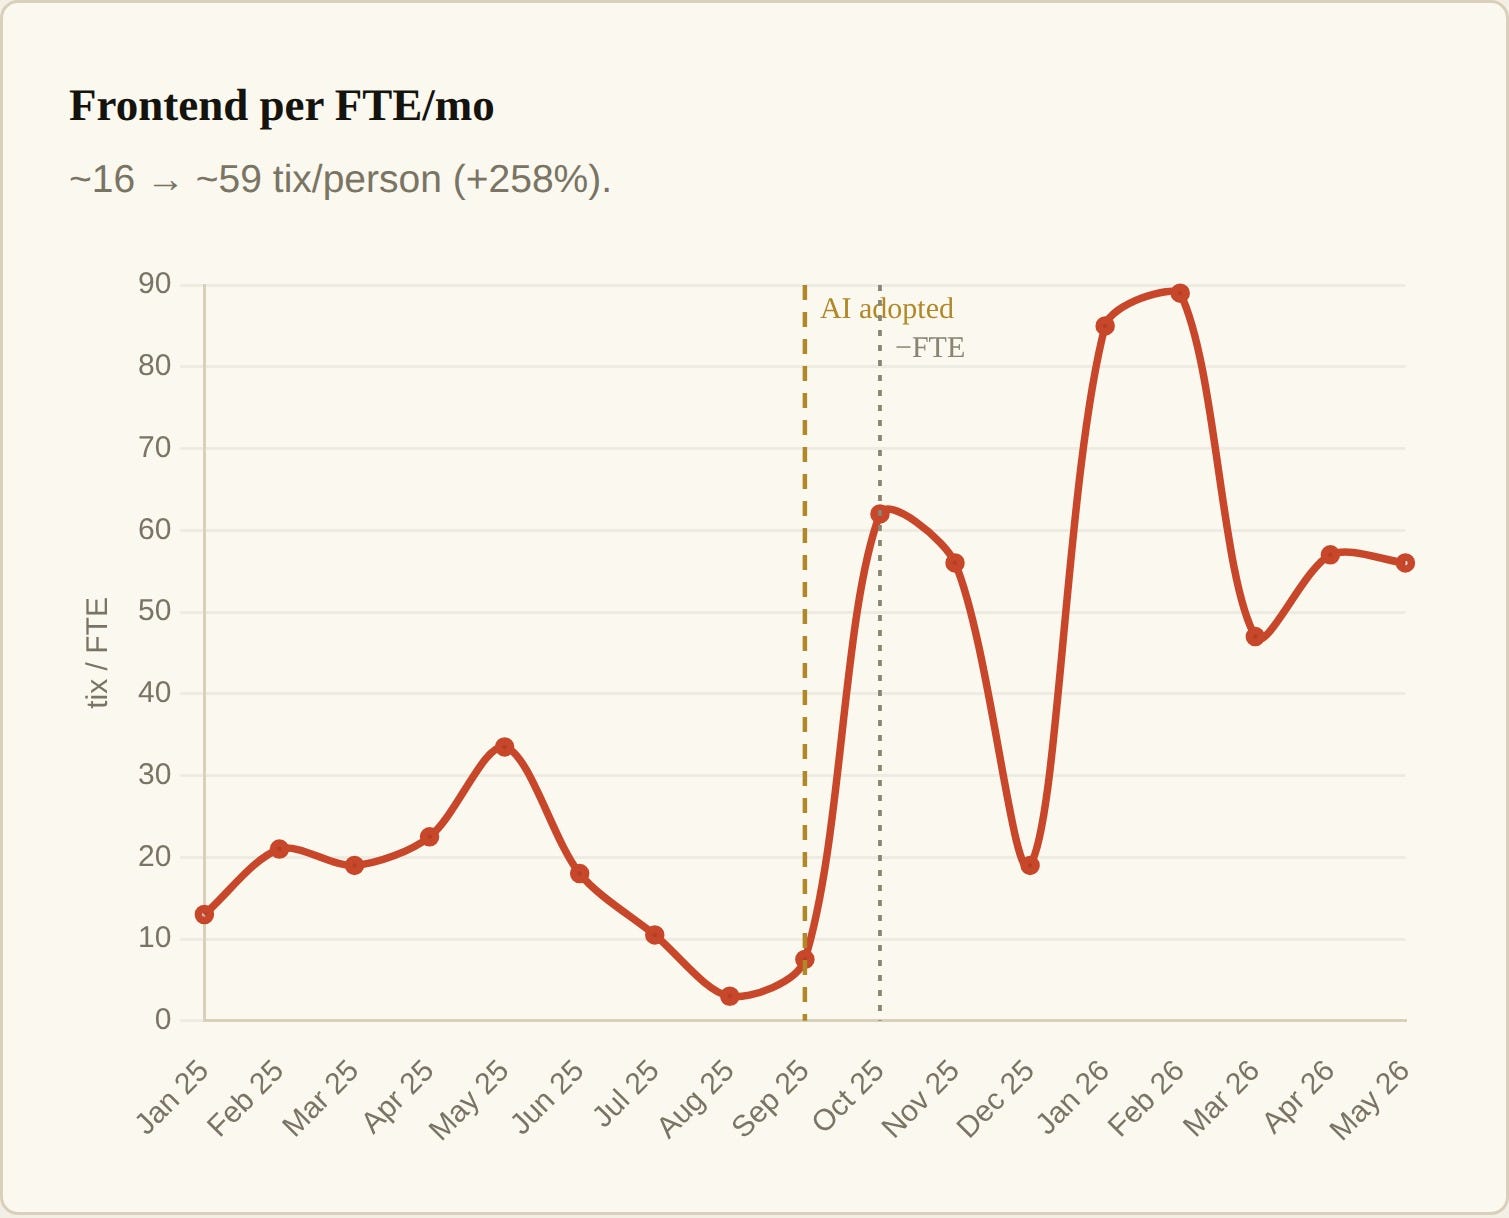
The gain shows up across both teams, not in one or two power users: Backend rose +158% (~7.4 → ~19 per engineer) and Frontend +258% (~16 → ~59), though the Frontend figure is volatile on a small team and is best read as directional. The signal is a broad, sustained uplift.
Bug velocity: quality or slop?
No defect explosion, and no miracle either. Bugs were already being closed at ~17–31/month before AI; afterward they rose a modest +52%, in line with simply doing more work. Bug share held steady in a 12–27% band the whole period, and bug cycle time actually fell (0.54 → 0.19 days). This is a nice win!

Adjusting for March major refactor (non-normal), the average ratio would restore to somewhere between 15% - 17%, which is lower than pre-AI era.
Tokens: did spend stabilise?
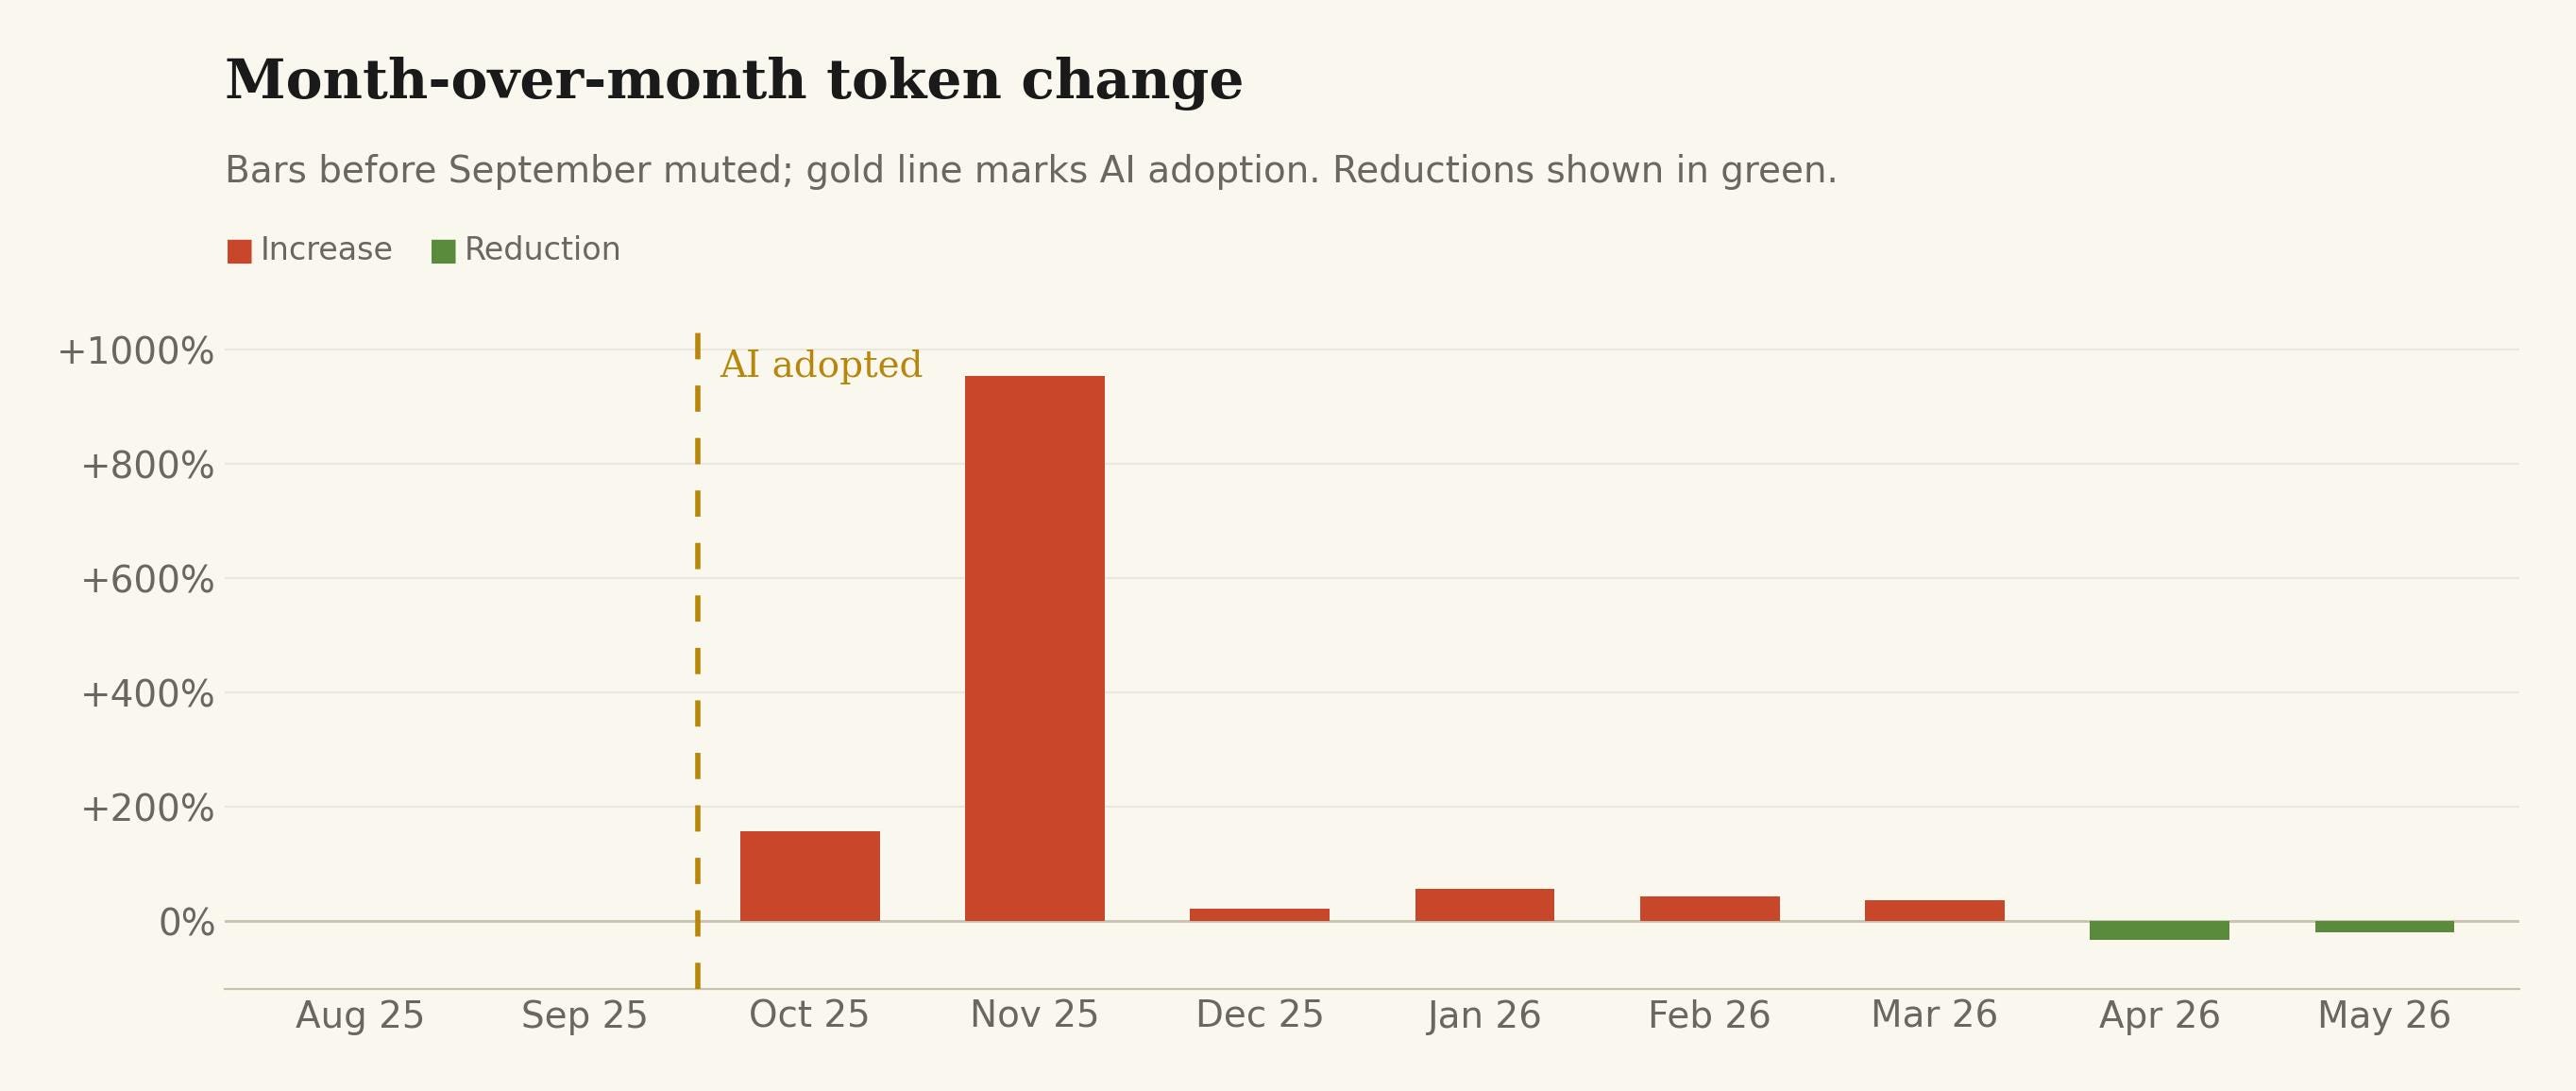
Based on raw data — No. The expectation was a spike followed by a plateau as scaffolding improved. Instead, once all tooling sources are counted (the first pass undercounted by ~44%), tokens per ticket rose from ~10M (Nov–Jan) to ~16M (Feb–May), and total monthly spend climbed to a ~4.2B peak in March. Productivity went up, but cost per unit of work went up with it — the opposite of the efficiency plateau the scaffolding thesis predicts. The one caveat: spend dipped in the last two months (4.2B → 2.3B), which might be an early peak, but two points isn’t a trend yet.

But this does not adjust for the March refactor. The MoM change tells a different story, where in % change, I am seeing a decline in April and May, which is the payback from the continued investment in the underlying infrastructure and tooling making AI better. If June also provides a down month, it could be fair to conclude that token spend is starting to stabilise as we are getting better at reusing context and knowledge.
The team has deployed all the modern infrastructure to make AI work reliably - skills, scaffolding, memory, shared context across repo, gaurdrails and we also have started to use our own Kerno Intelligence Tooling (KIT)* since May.
*KIT is a set of code intelligence tools delivered via MCP that replaces broad, expensive searches with precise, indexed lookups. Instead of reading entire files, agents can jump directly to symbol definitions, find all usages across a codebase, trace call chains, and list endpoints without touching unnecessary code, which can reduce token consumption by 90%+.
Supporting signal: cycle time
Median time-to-close fell 60% (1.79 → 0.72 days, trending toward ~0.1 by spring 2026). Work isn’t just higher in volume, it’s closing roughly twice as fast, which corroborates the per-person productivity story.

Again, bug cycle time actually fell by 65% which was a pleasant suprise.
Conclusion
I’m making this conclusion with the adjustment in data for March. Also, I care more about directional signal versus absolute precision aka +/- 20% is fine… I am not spending $100M+ in tokens 🤣
Overall AI has accelerated productivity across our engineering organisation. The ROI is clear. Without AI, we would have not been able to ship features at a record pace while absorbing losses in our team.
While this is giving me signal, what this report doesn’t capture is the significant amount of investment we have made to the underlying infrastructure to make AI code generation work for the team.
Skills, memory layers, benchmarking, documentation, prompt-engineering, knowledge sharing, testing and much more have been a significant upfront and continued investment to make this tool a reliable…..tool. This is the sunk cost of using AI. I estimate this for our team size to be equivalent to 0.5xFTE* per year ~$50,000.
* 2-3 hours of upkeep per week per engineer = 2 x 7 engineers = 14 hours per week
This translates to 33% of the total cost of AI enablement ownership (tokens + cloud + engineering).
For every engineer post AI, the output is 3x, for simple maths, assume salary is $100K, which means, to achieve the same output, you’d need 3 engineers at $100K each.
So the ROI math for a 7 person engineering team is
With AI: $150K + $700K = $0.8M
Without AI: 21 x $100K = $2.1M
NET ROI = $1.3M
While the eagle eyed data scientist in you might be quick to point out the flaws - this ROI is not tied to realised gains, aka impacting the P&L in the form of tangible $$ (not making that public) or cost cutting. But for me, it’s enough to give me directional signal to continue the investment, and even ramp up the investment. AI has been additive.
Translating this to bigger more complex organisations needs to factor in Conways law. I have found that scaling anything beyond two pizza teams requires a totally different implementation plan and timeline expectations. I also don’t think the AI enablement cost scales linearly, it’s more logarithmic.
P.S if you want the skill that helped me design this report/graphs, just respond to this email.
Actionable takeaways
Assessment of skills we use, and upgrade accordingly
Weave in PR analysis to help understand where bottlenecks are in cycle time.